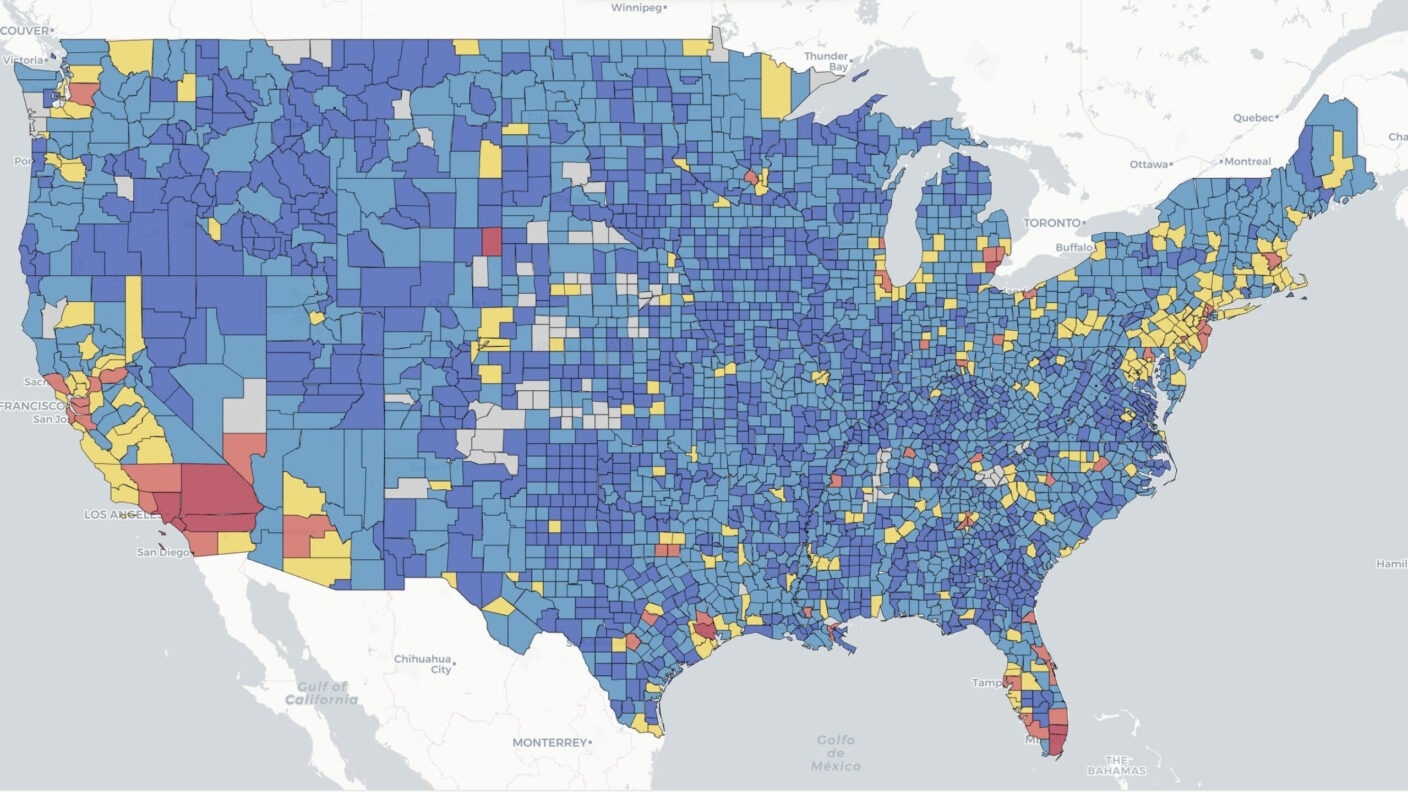
With outages worsening by 20% each year, the new AI-driven PSVI map reveals which U.S. regions face the greatest power grid vulnerabilities, and why urgent investment in resilience is needed.

Researchers at Texas A&M University have created a Nationwide Power System Vulnerability Index that assigns individual counties a rating based on their likelihood of being affected by power outages. Image Credit: Urban Resilience AI Lab
Hurricane Beryl, Winter Storm Uri, and other severe weather events have increased long-term power outages for Texas residents in recent years. But this issue does not just affect Texans.
Researchers from the Urban Resilience AI Lab at Texas A&M University have used machine learning to create a nationwide Power System Vulnerability Index (PSVI) that identifies areas at increased risk of power outages.
"Using data from Oak Ridge National Laboratory, we were able to study the effect of weather events on the frequency and duration of nationwide power outages over the past 10 years," said Dr. Junwei Ma, a postdoctoral researcher in the Zachry Department of Civil and Environmental Engineering. "The dataset included over 179 million data points sorted by time and location, allowing us to create the PSVI."
The study's results show an increase in the extent of weather-induced power outages. Trends show an increase in the length and frequency of power outages, with more customers being affected annually.
Authors of this paper - including Ma, his fellow postdoctoral researcher Dr. Bo Li, Dr. Olufemi A. Omitaomu from Oak Ridge National Laboratory, and Dr. Ali Mostafavi, a professor in the Zachry Department of Civil and Environmental Engineering - identified several regions they would consider hot spots, facing the highest levels of power system vulnerability. Hot spots include the East and West Coasts and the Great Lakes and Gulf regions, indicating areas of dense development face higher vulnerability for power outages.
The research team identified the hot spots and annual increase rate trends thanks to their novel and publicly available PSVI map.
"This is an interactive tool that can showcase the overall PSVI ratings and scores of individual U.S. counties over the past decade, and how vulnerability shifts year by year," said Ma.
Researchers also observed that many AI data centers - like the ones used to store this study's data - are located in the hot spots, showing the need for increased investments in infrastructure to protect these resources.
By using a type of machine learning called explainable AI, this software goes beyond just sorting data. It can identify trends. This innovation is central to a series of studies on power outage vulnerability from the Urban Resilience AI Lab. Previous studies have revealed growing and disparate vulnerabilities in the U.S. power system.
"We knew that the state of power system vulnerability nationwide is exacerbating. But the magnitude of that was shocking, and greater than we hypothesized," said Mostafavi, who also serves as the director of the Urban Resilience AI Lab. "After 2019, we see a 20% annual increase in outage duration, frequency and magnitude."
Knowing an area is at-risk allows policymakers to prioritize preparation for lengthy and frequent power outages, reducing associated socioeconomic impacts, such as limited access to food and the inability to travel to work. Understanding power system vulnerability is key for stakeholders making decisions that impact community resilience.
By Alyssa Schaechinger, Texas A&M University College of Engineering
Source:
Journal reference:
- Ma, J., Li, B., Omitaomu, O. A., & Mostafavi, A. (2025). Establishing nationwide power system vulnerability index across US counties using interpretable machine learning. Applied Energy, 397, 126360. DOI: 10.1016/j.apenergy.2025.126360, https://www.sciencedirect.com/science/article/abs/pii/S0306261925010906